Replacing a PDF
with a System
Designing a dynamic material estimating calculator that cut contractor estimation time from 2 hours to 12 minutes, drove a 3.2× increase in engaged sessions, and achieved an 89% task completion rate after launch.
The starting point
Siplast makes commercial roofing systems installed by contractors on large-scale jobs. Before any project starts, contractors need to estimate exactly how much material they need: primer, membrane, flashing, and catalyst, calibrated to project size, temperature, and substrate. Getting it wrong meant over-ordered materials, delayed jobs, and bids submitted with incorrect numbers.
The tool Siplast gave them to do this was a stack of printed PDF guides.

- Manual cross-referencing of printed PDF tables
- No validation or error checking
- 2 hours per estimate, per project
- No way to save, share, or revisit work
- Every job required starting from scratch
- Dynamic inputs that adapt to project variables
- Real-time validation and calculation feedback
- Structured outputs by material layer
- Save, share, and export to PDF
- Scalable across multiple roofing systems
"Hours per estimate. No validation. No real-time feedback. And every job is different: different square footage, substrate, temperature, waste factor. The PDF couldn't adapt."
A workflow built on the wrong foundation
The problem wasn't that contractors couldn't do the math. It was that the process forced unnecessary cognitive work at every step, with no way to catch mistakes before they became costly.
Manual and fragile
Paper-based cross-referencing with no validation meant errors weren't caught until materials arrived on site, or didn't arrive at all.
Zero adaptability
Every project varies by square footage, substrate, and temperature. The static PDF couldn't account for any of it without manually reworking every calculation.
No feedback loop
Contractors had no confirmation that numbers were reasonable. There was no way to save, share, or hand off results when finished.
Owning the problem end-to-end
I was the sole designer on this project. I worked directly with product and engineering to define the logic, build the experience, and ship it. My work spanned three phases, and the most important happened before any screen was designed.
Discovery & alignment
Working with stakeholders to map what contractors actually needed, not just what the PDF covered: coverage rates, waste factors, material dependencies, and real project variability. This surfaced two user types: the experienced estimator who wants speed, and the first-timer who needs guidance.
System architecture
Defining the calculation logic alongside engineering: what inputs were needed, how they flowed into outputs, and where to draw the line between live feedback and an explicit calculate step. Product logic work, not UI work.
Interface design
Translating system logic into an experience that felt simple, even when underlying inputs were complex. Progressive disclosure, real-time feedback, and outputs contractors could save and share.
Designing the logic before the UI
Material estimation isn't a simple calculator, it's a multi-variable engine where changing one input cascades to the rest. I worked with engineering to define that logic first, then built it to scale across 4+ roofing systems and 12+ material combinations.
- Project details
- Square footage
- Temperature at application
- Material system selection
- Waste factor
e.g., how waste factors and coverage rates needed to remain editable without breaking downstream outputs.
- Coverage rates per material
- Waste factor adjustments
- Business rules
- Material database
e.g., field testing revealed contractors needed total unit summaries, not just per-system breakdowns.
- Material quantities by layer
- Cost breakdown (optional)
- Reference charts
- Recommendations
- Save estimates
- Share with project team
- Export to PDF
- Print results
What we debated and why
The most interesting design challenges on this project weren't visual, they were structural. Here's how we solved them.
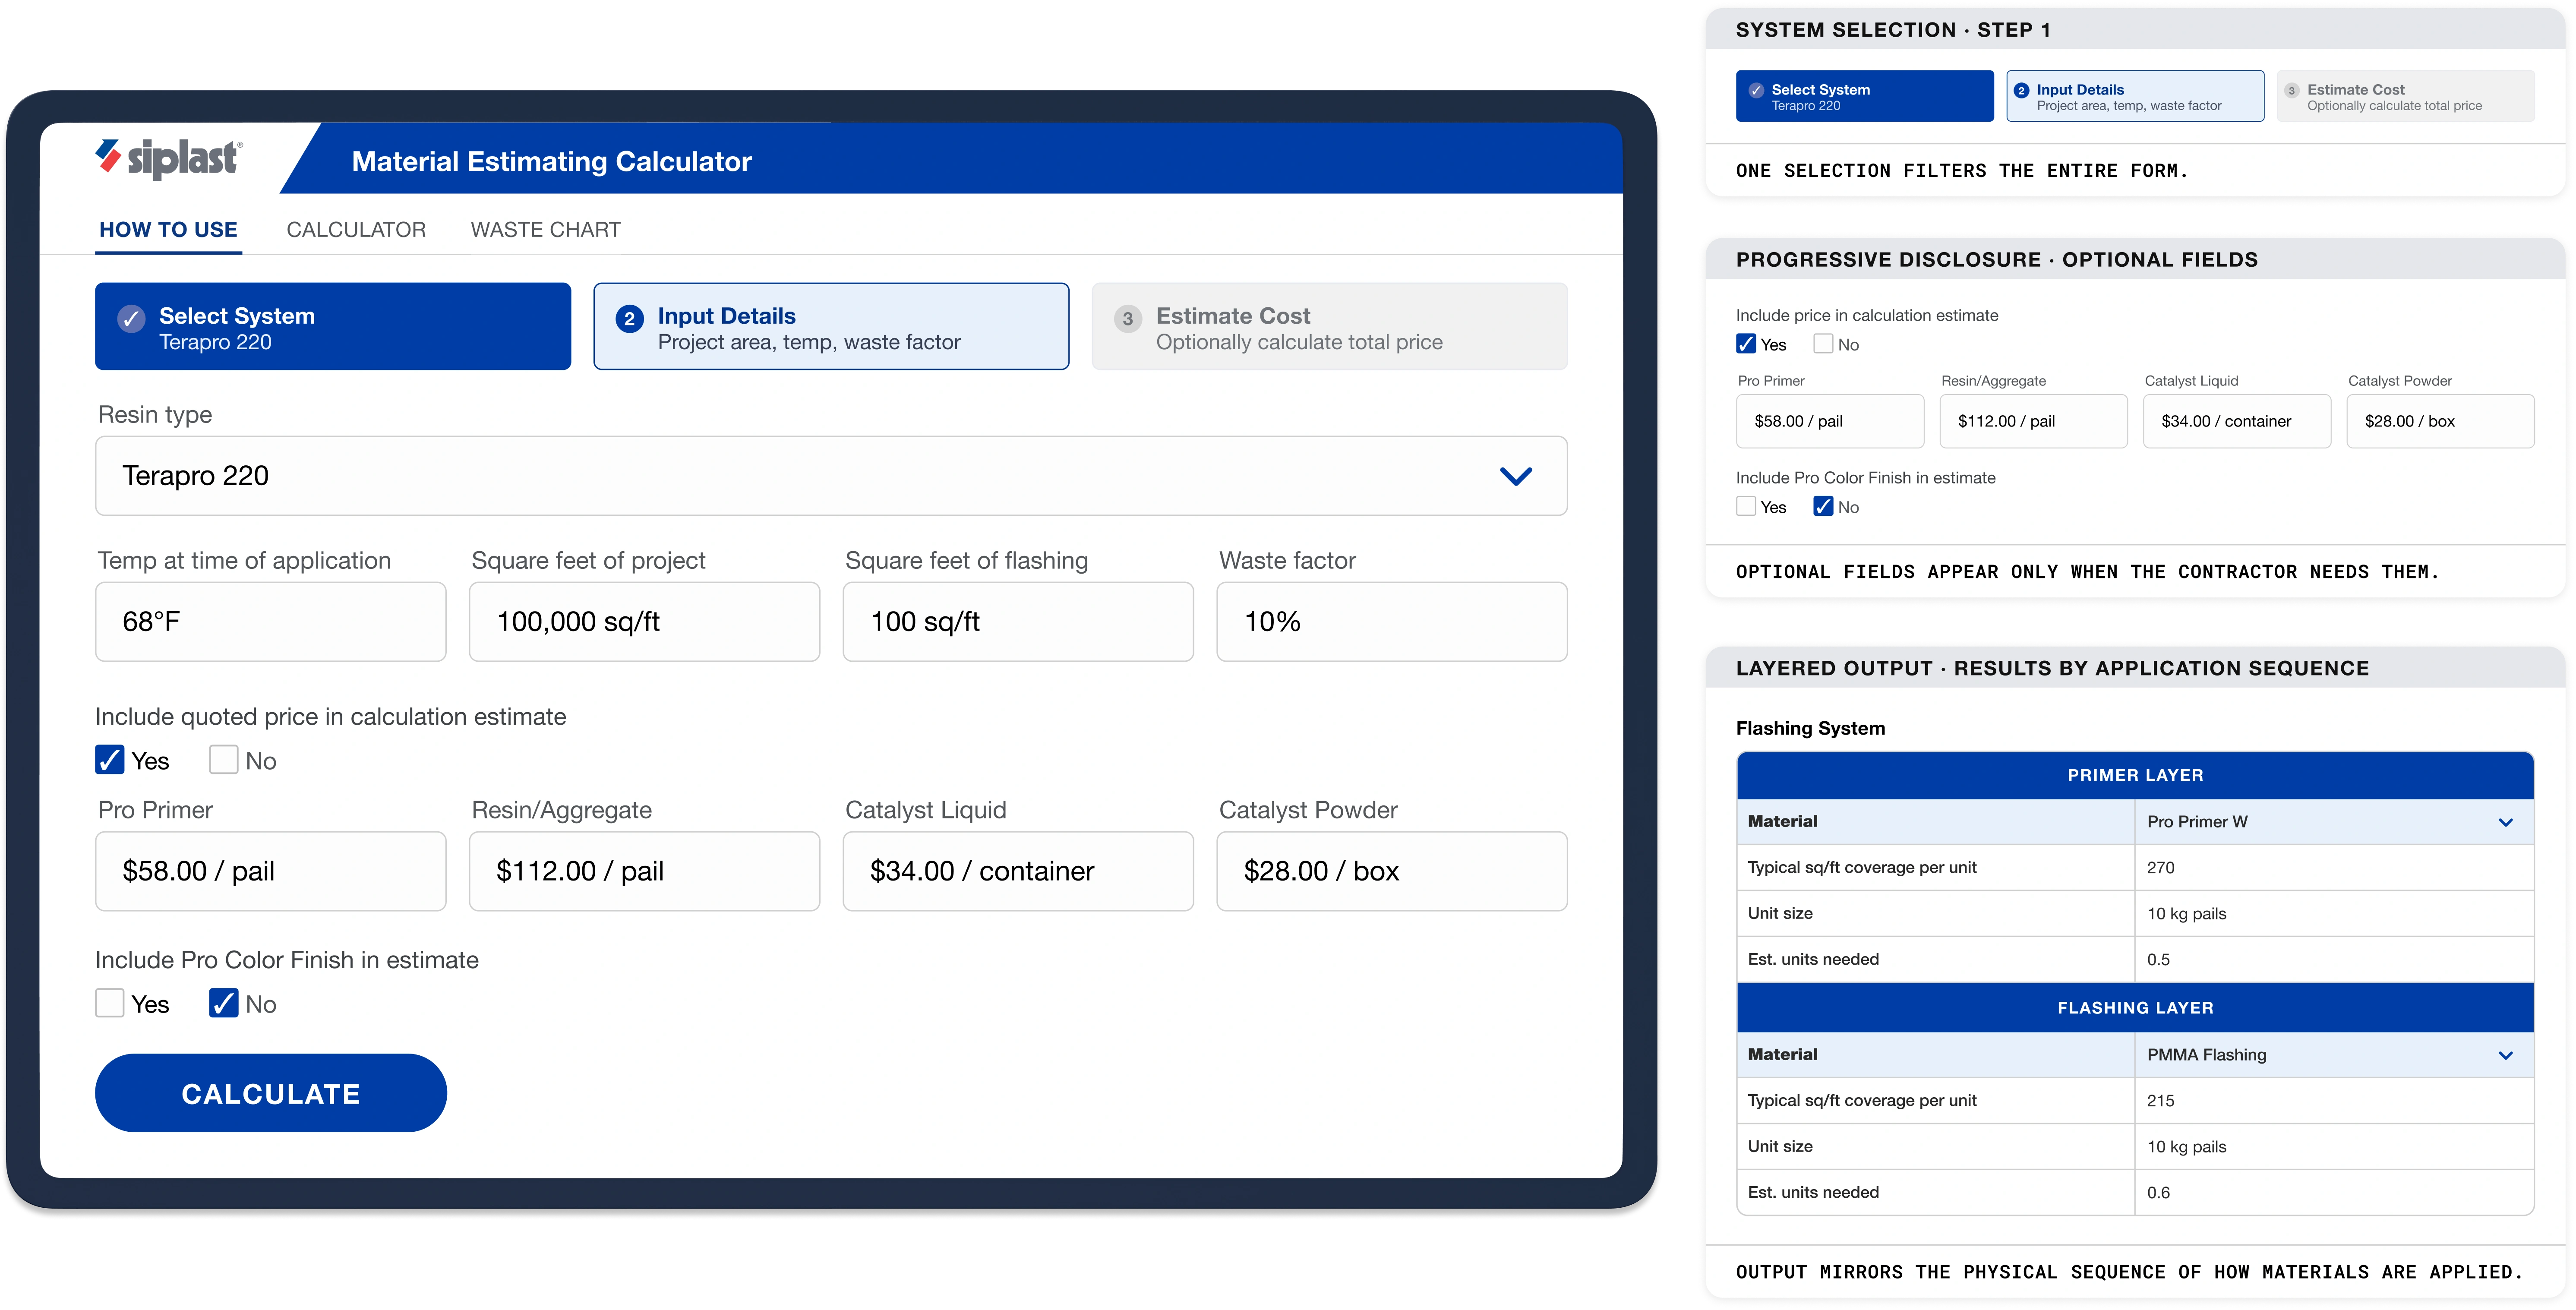
How to handle input variability
Surfacing all inputs at once was comprehensive but overwhelming. We used progressive disclosure: required inputs first, optional below a clear break, keeping it simple for standard jobs and flexible for complex ones.
Real-time vs. submit-to-calculate
Contractors adjust inputs iteratively and want to see results immediately. We chose real-time feedback for core fields, with an explicit Calculate step for the full output: responsive without feeling unstable.
Output structure: flat list vs. layered view
A flat material list didn't match how contractors think about a job. Restructuring results by application layer (Primer → Flashing → Field Membrane) matched their existing mental model with no re-learning required.
Digital-only vs. hybrid workflows
Contractors plan digitally but often work from paper on site. We added PDF export and save-as-estimate to bridge both, so the tool retained its value even without connectivity.
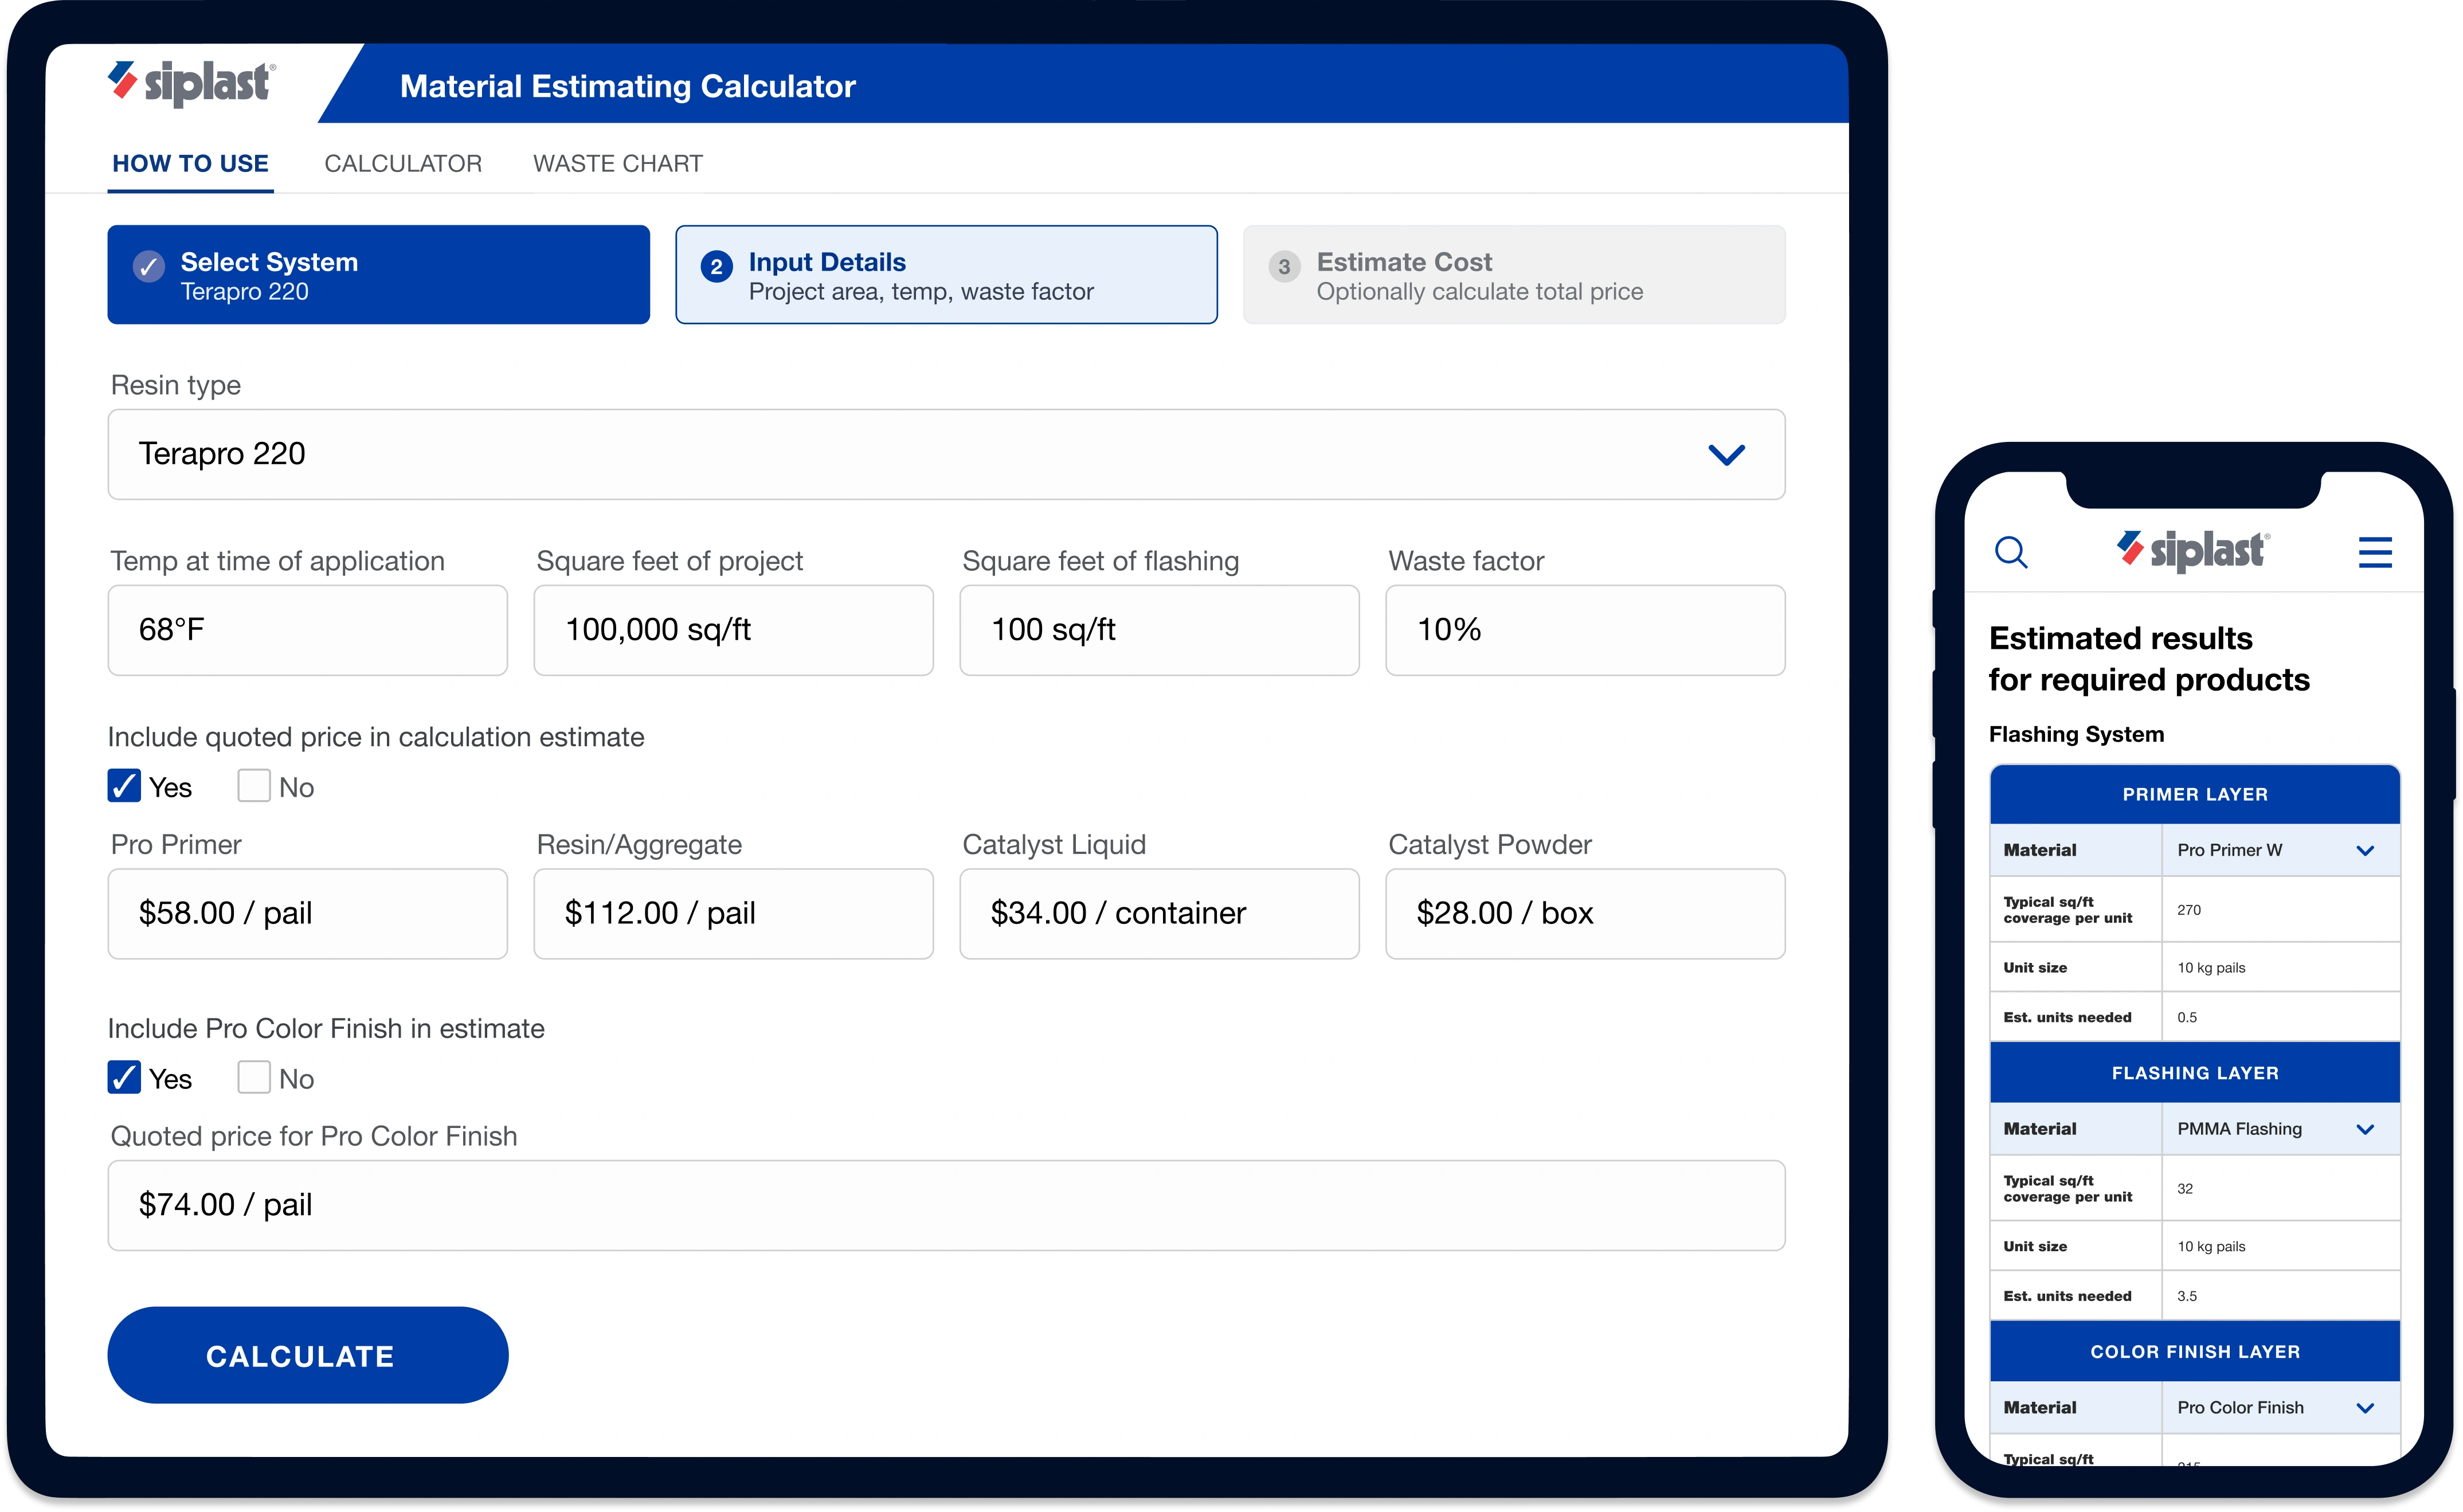
From input to estimate in three steps
Designed around one principle: reduce friction without sacrificing accuracy. System selection filters the form, optional sections appear on demand, and results follow the sequence of how materials are applied on site.
Step 1 of 3
Choose your system
One selection filters all material options automatically.
Step 2 of 3
Enter project details
Optional fields appear only when they apply to your system.
Include quoted price in calculation estimate
Include Pro Color Finish in estimate
Step 3 of 3
Results by application layer
Ordered to match how materials are physically applied on site.
Estimated results for required products
Results mirror the physical sequence of how materials are applied.
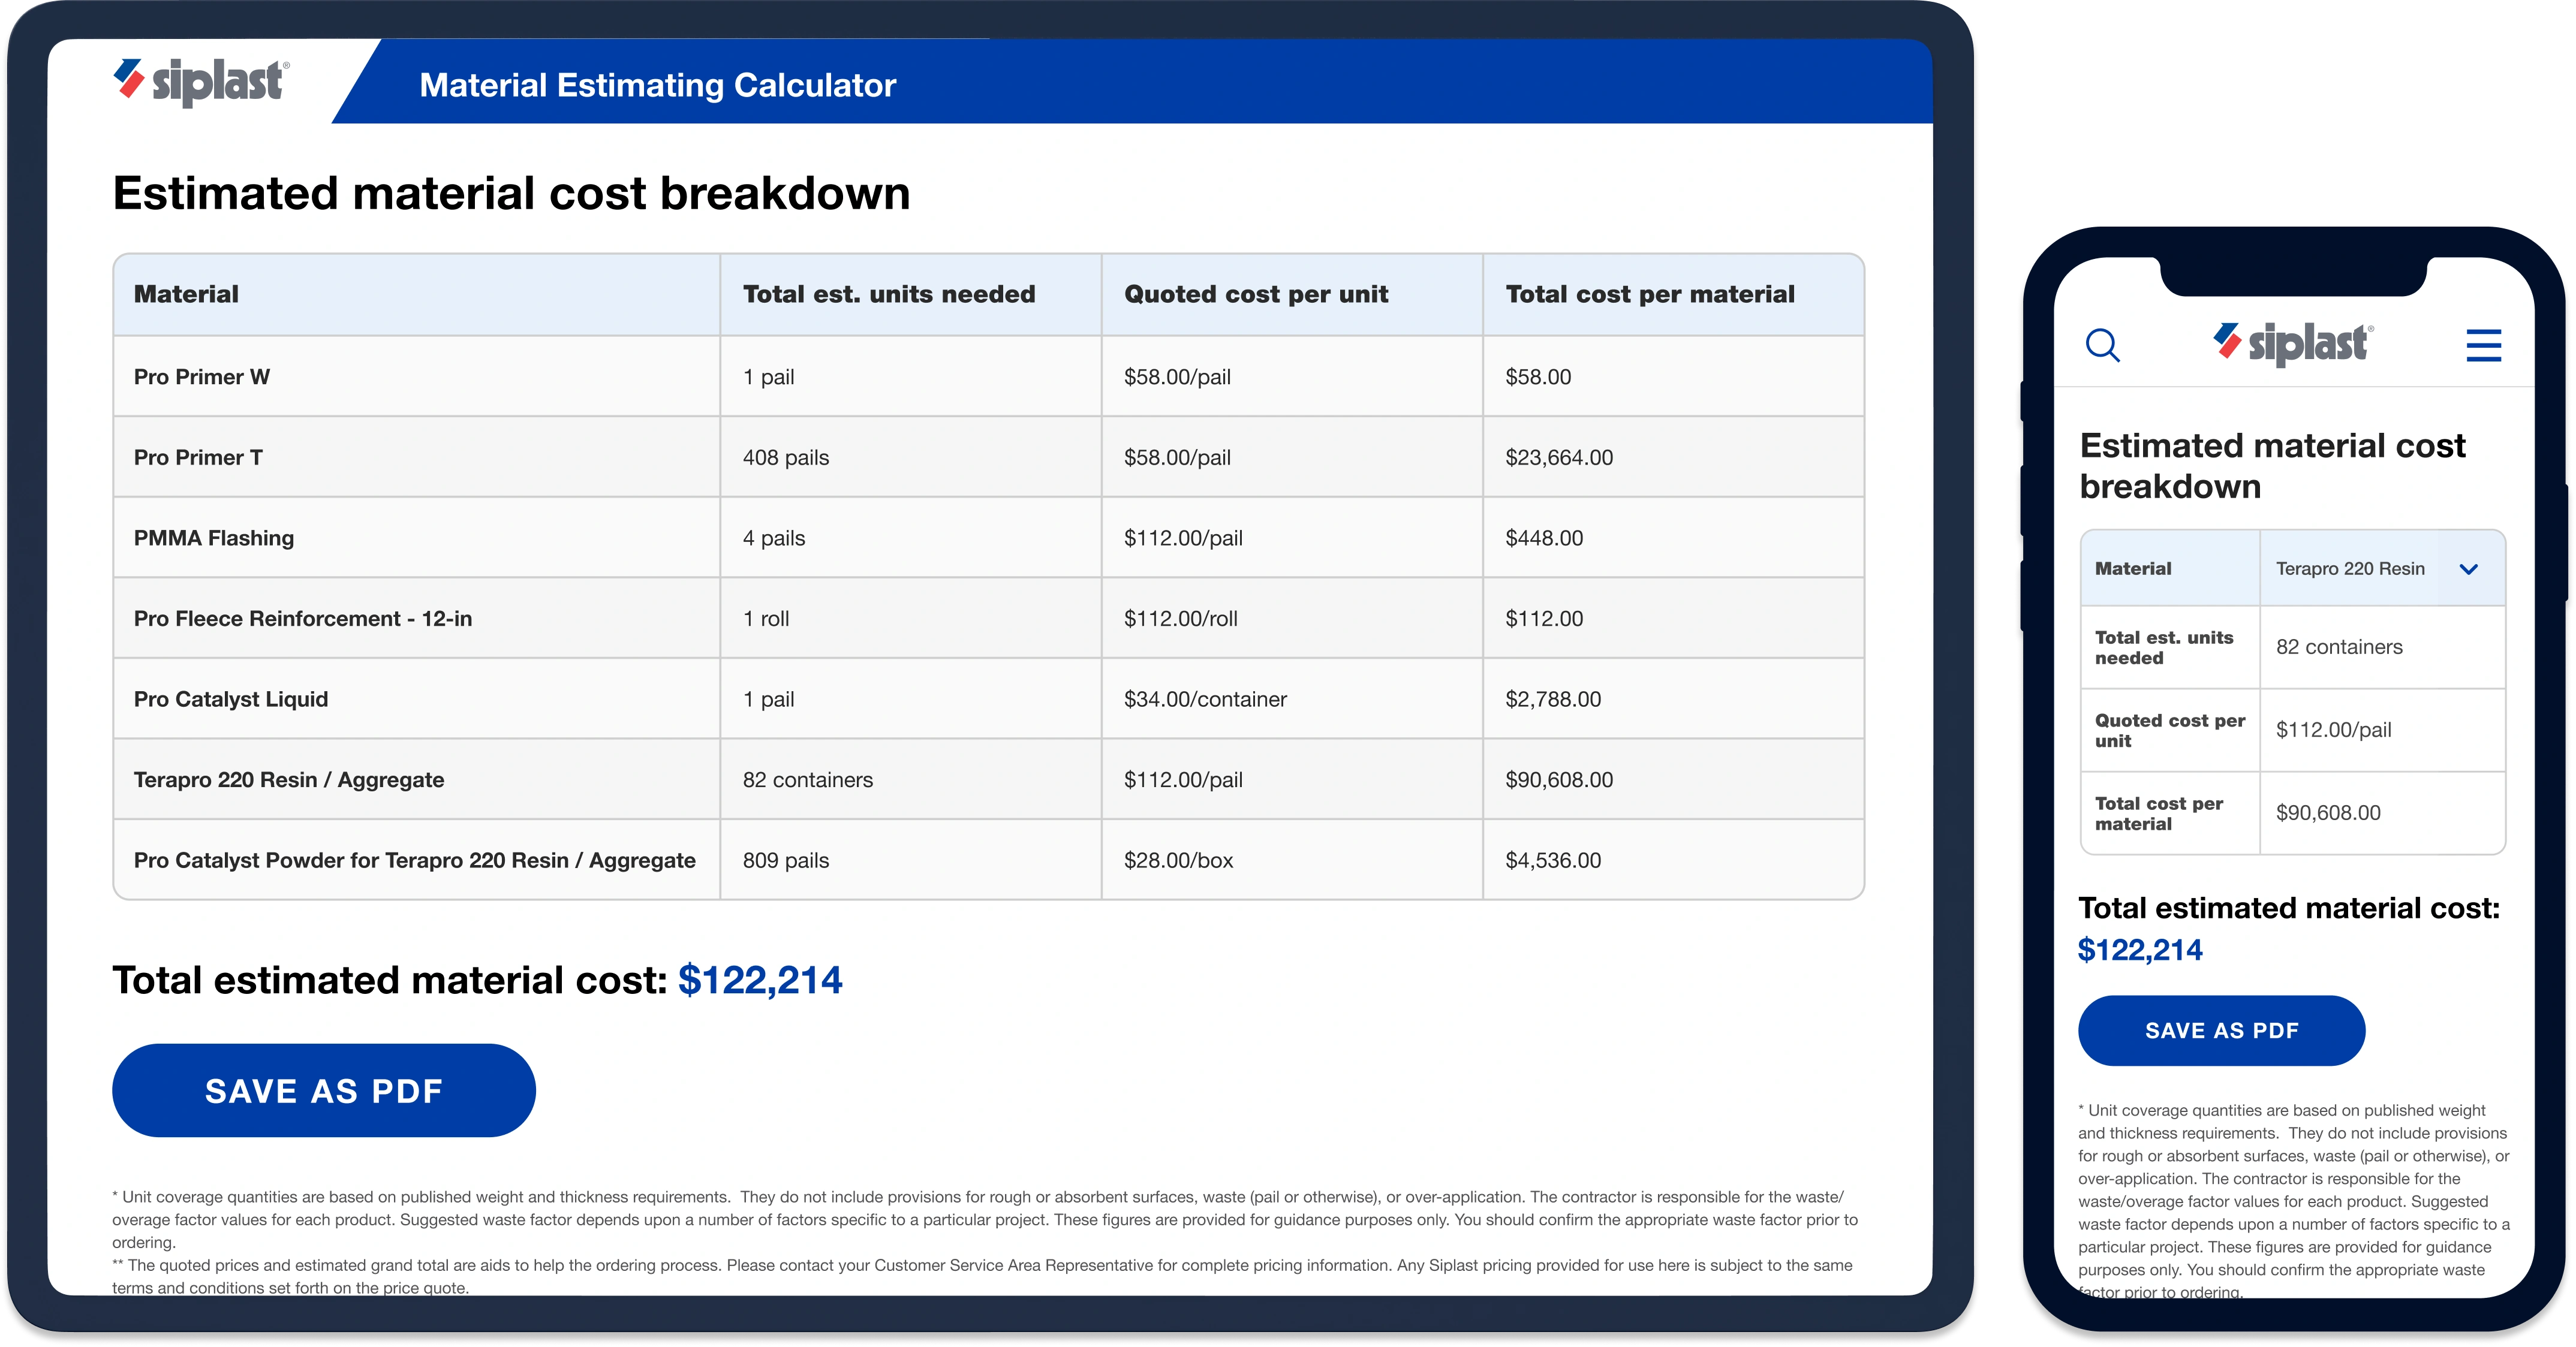
Contractors bring their own prices. The tool does the rest.
Once materials are calculated, contractors can optionally enter their quoted prices per unit. The tool generates a full cost breakdown by material and a total estimate: ready to save as PDF, share with a project manager, or use for bid preparation.
What changed after launch
Replacing a printed PDF with a digital tool only works if people actually use it. The numbers below reflect contractors choosing the tool over their existing process, repeatedly.
What I'd do differently
The calculator launched successfully and drove real adoption, but there are three things I'd approach differently given more time and access.
Earlier contractor involvement in the logic phase
- Contractors were involved in shaping the output format, but later in the process than they should have been.
- I'd involve contractors earlier to help define the output structure so format decisions are grounded before iteration begins.
A stronger first-use experience
- The tool works well for contractors who already know what inputs to provide. It provides no real on-ramp for first-time users.
- I'd add smart defaults and inline tips about what each field affects so contractors can get to a useful result on the first try.
Success criteria defined upfront
- We proved strong impact after launch, but we defined what success looked like as we went rather than committing to target metrics before building.
- In the future, I'd now define success before building, not after. Agreeing on rough targets up front, like estimation time and adoption, gives the team something concrete to design against instead of discovering what mattered once it shipped.
The interface is the last mile.
The real design work, the part that determines whether a tool is trusted and used, happens before any screen is built: in the logic, the structure, and the alignment with the people who understand the problem from the inside. The discipline isn't about making things look good. It's about making complex systems feel inevitable.

or simply want to say hi?